- Đăng vào
Đọc cảm biến Waveshare IMU 10 DOF và hiển thị trên Matlab
Waveshare IMU 10 DOF
Bài viết này sẽ hướng dẫn các bạn đọc cảm biến Waveshare IMU 10 DOF bằng Arduino Uno và truyền dữ liệu lên Matlab để vẽ đồ thị theo thời gian thực.
Tính năng
MPU9255 : 3-axis gyroscope, 3-axis accelerometer, and 3-axis compass/magnetometer
- Internal Digital Motion Processing™ (DMP™) engine, offloads complicate fusion calculation, sensor synchronization, gesture recognition, etc.
- Internal Digital Motion Processing™ (DMP™) engine, offloads complicate fusion calculation, sensor synchronization, gesture recognition, etc.
- Comparing with MPU6050, the MPU9255 is lower power consumption, and more suitable for wearable devices
BMP180 : barometric pressure sensor
- Embedded temperature sensor for temperature compensation
You can get the 10 DOF data through I2C interface
Thông số kỹ thuật
Power : 3.3V~5.5V (internal voltage regulation with low dropout)
Accelerometer
- Resolution : 16 bit
- Measurement range (configurable) : ±2, ±4, ±8, ±16g
- Operating current : 450uA
Gyroscope
- Resolution : 16 bit
- Measurement range (configurable) : ±250, ±500, ±1000, ±2000°/sec
- Operating current : 3.2mA
Compass/Magnetometer
- Resolution (configurable) : 14 or 16 bit
- Measurement range : ±4800µT
- Operating current : 280uA
Barometric pressure sensor
- Resolution (configurable) : 16~19 bit
- Measurement range : 300
1100hPa (altitude : +9000m-500m) - Accuracy : 0.02hPa(0.17m)
Kết nối với Arduino

Sơ đồ đấu dây với Arduino
Các bạn download code Arduino ở bên dưới bài viết (Code này có tích hợp giải thuật AHRS để xác định hướng của IMU, cái này mình download trên mạng và chỉnh sửa để hoạt động với cảm biến IMU mà mình có). Chi tiết các bạn có thể xem trong phần commnent trong code và tùy ý chỉnh sửa.
Một số phần mà mình đã thực hiện:
- Tốc độ truyền 115200
- Thời gian lấy mẫu 100Hz
- Protocol truyền dữ liệu lên máy tính: [ax;ay;az;gx;gy;gz;mx;my;mz;Yaw;Pitch;Roll;/n . Đây là định dạng do mình quy ước, trên Matlab sẽ có đoạn code để phân tách dữ liệu
Real time plot Matlab
Đoạn chương trình dưới đây lấy dữ liệu từ protocol mà mình đã xác lập từ Arduino và vẽ đồ thị thời gian thực giá trị ax, hình dưới thể hiện kết quả nếu chạy thành công.
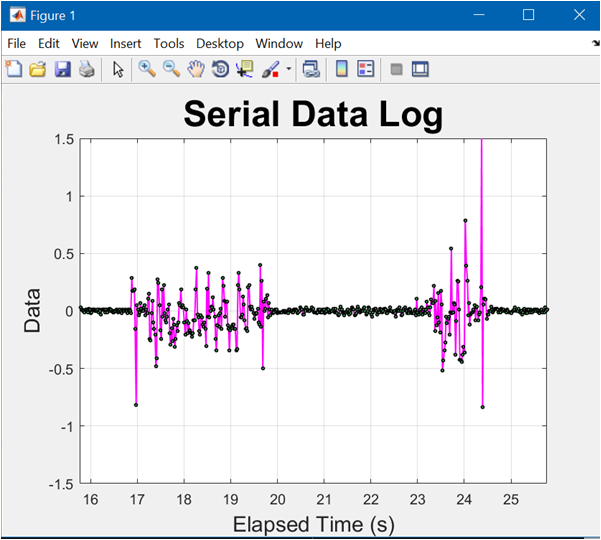
Serial Data Log
%%% Realtime Plot MPU9255
%%% author: nvtienanh
%%% web: nvtienanh.info
clear
clc
close all
SerialPort = serial('COM3','BaudRate',115200,'Timeout',3);
set(SerialPort, 'Terminator', 'LF'); % Default terminator is \n
set(SerialPort,'DataBits',8);
set(SerialPort,'StopBits',1);

plotTitle = 'Serial Data Log';  % plot title
xLabel = 'Elapsed Time (s)';    % x-axis label
yLabel = 'Data';                % y-axis label
plotGrid = 'on';                % 'off' to turn off grid
min = -1.5;                     % set y-min
max = 1.5;                      % set y-max
scrollWidth = 10;               % display period in plot, plot entire data log if <= 0

%Define Function Variables
time = 0;
data = 0;
count = 0;

%Set up Plot
plotGraph = plot(time,data,'-mo',...
                'LineWidth',1,...
                'MarkerEdgeColor','k',...
                'MarkerFaceColor',[.49 1 .63],...
                'MarkerSize',2);

title(plotTitle,'FontSize',25);
xlabel(xLabel,'FontSize',15);
ylabel(yLabel,'FontSize',15);
axis([0 10 min max]);
grid(plotGrid);

fopen(SerialPort);
SerialPort.ReadAsyncMode = 'continuous';
readasync(SerialPort);
MPU_Connect_OK = true;
MPUData=[];
unit_conv = [9.81 9.81 9.81 1 1 1 1 1 1 1 1 1]';
tic
while ishandle(plotGraph) %Loop when Plot is Active

    str = fscanf(SerialPort, '%c');
    if ~isempty(str)
        if (str(1)=='[')
        % Data Message: [ax;ay;az;gx;gy;gz;mx;my;mz;Yaw;Pitch;Roll;
        CurData = sscanf(str(2:end),'%f;');
        CurData = CurData.*unit_conv;
        MPUData = [MPUData;CurData'];
        count = count + 1;
        time(count) = toc;    %Extract Elapsed Time
        data(count) = CurData(1); %Extract 1st Data Element
        %Set Axis according to Scroll Width
        if(scrollWidth > 0)
            set(plotGraph,'XData',time(time > time(count)-scrollWidth),'YData',data(time > time(count)-scrollWidth));
            axis([time(count)-scrollWidth time(count) min max]);
        else
            set(plotGraph,'XData',time,'YData',data);
            axis([0 time(count) min max]);
        end

        %Allow MATLAB to Update Plot
        drawnow
        elseif (str(1)=='<')
            % Comment Message: if (MPU_Connect_OK || ~ishandle(plotGraph))
    stopasync(SerialPort);
    fclose(SerialPort); % bad
    delete(SerialPort);
    clear SerialPort;
end

clear count max min plotGraph plotGrid plotTitle ...
        scrollWidth xLabel yLabel;

disp('Session Terminated...');
Đây là video demo của mình