- Đăng vào
Vẽ giản đồ Bode từ dữ liệu thực nghiệm bằng Matlab
Giới thiệu
Bài viết này sẽ hướng dẫn xử lý và lọc sơ bộ tín hiệu trước khi tính toán và vẽ giản đồ Bode. Giả sử tiến hành khảo sát hệ thống với thời gian lấy mẫu 0.01s, tín hiệu ngõ vào và ngõ ra đo được có dạng như trong bảng dưới. Sau mỗi lần khảo sát, dữ liệu được lưu vào file data.mat. Sau nhiều lần các dữ liệu được lưu vào file data1.mat, data2.mat ... Các file dữ liệu mẫu download ở cuối bài viết.
Times Input Ouput
0 0 0.5000
0.0100 0.6909 0.9618
0.0200 1.0065 0.9001
0.0300 0.7767 0.3506
0.0400 0.1292 -0.3846
... ... ...
Kiểm tra dữ liệu
Dùng hàm plot để vẽ đồ thị tín hiệu thô, qua đó có đánh gia sơ bộ
% Tien Anh
% https://bmshop.vn
load('data1.mat') % import data
times = data(:,1); % times
figure(1);
grid on
hold on
plot(times,data(:,2),'-r'); % input
plot(times,data(:,3),'-b'); % output
Kết quả:
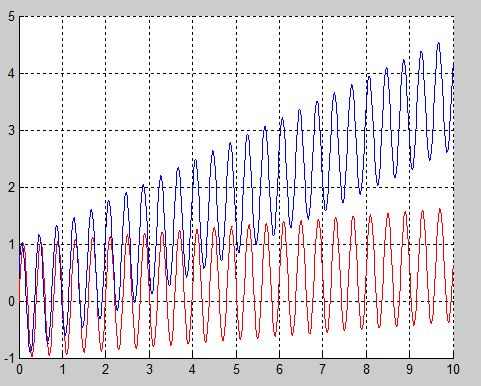
Tín hiệu thô
Bộ lọc butterworth
Giới thiệu bộ lọc butterworth: (đang cập nhật)
load('data1.mat') % import data
times = data(:,1); % times
% su dung ham dtrend de offset data
% Minh chua ro doan nay lam
input=dtrend(data(:,2),3);
output=dtrend(data(:,3),3);
% Minh chua ro cach dung bo loc butter
[B,A] = butter(3,0.2);
input_filted = filter(B,A,input);
output_filted = filter(B,A,output);
figure(3);
grid on
hold on
plot(times,input_filted,'-r',times,output_filted,'-b');
Kết quả:
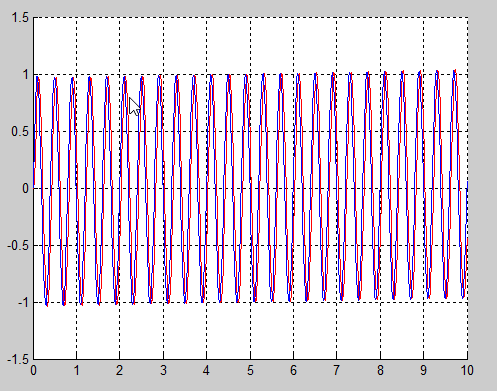
Tín hiệu sau khi lọc
Vẽ giản đồ Bode
%% Plot bode from experimental data - version 0.5
%   Author: Tien Anh
%   Info: https://bmshop.vn
%   Info: Matlab 2014a
%%
clc;
clear all;
points_bode = [0 0 0];
% vong lap ve cho 9 mau du lieu
for idx=1:9
    filename=sprintf('data%s.mat',num2str(idx));
    Data = importdata(filename);
    times = Data(:,1);
    t_sampling = Data(2,1)-Data(1,1); % Sampling time
    %% Offset data
    input=dtrend(Data(:,2),3);
    output=dtrend(Data(:,3),3);
    %% Butterworth Filter
    [m,n] = butter(3,0.2);
    input_filted = filter(m,n,input);
    output_filted = filter(m,n,output);
    index_in=0;
    %% Find maxima of input
    for k=2:length(input_filted)-1
        if input_filted(k)>input_filted(k-1) && input_filted(k)>input_filted(k+1)
            index_in = [index_in;k];
        end
    end
    index_in(1,:)=[]; % Trim data
    %% Find average of input frequencies
    temp = 0;
    for k=1:length(index_in)-1
        temp=[temp;1/((times(index_in(k+1))-times(index_in(k))))];
    end
    temp(1,:)=[]; % Trim data
    freq = mean(temp);
    Wn = 2*pi*freq;
    index_out=0;
    %% Find maxima of output
    for k=2:length(output_filted)-1
        if output_filted(k)>output_filted(k-1) && output_filted(k)>output_filted(k+1)
            index_out = [index_out;k];
        end
    end
    index_out(1,:)=[]; % Trim data

    %% Tim bien do va do lech pha
    bode_data = zeros(1,2);
    for k=1:length(index_out)
        if (output_filted(index_out(k))/input_filted(index_in(k))>=1)
            L = 20*log10(output_filted(index_out(k))/input_filted(index_in(k)));
            phi = (times(index_in(k))-times(index_out(k)))*360;
            bode_data=[bode_data;[L,phi]];
        end
    end
    bode_data(1,:)=[];

    points_bode = [points_bode;[mean(bode_data) Wn]];
end
points_bode(1,:)=[];
%% Make plot
figure(1); clf
%  Magnitude plot on top
subplot(2, 1, 1)
semilogx(points_bode(:,3), points_bode(:,1), 'r-o');
grid on
%  Phase plot on bottom
subplot(2,1,2)
semilogx(points_bode(:,3), points_bode(:,2), 'r-o')
grid on
Kết quả:
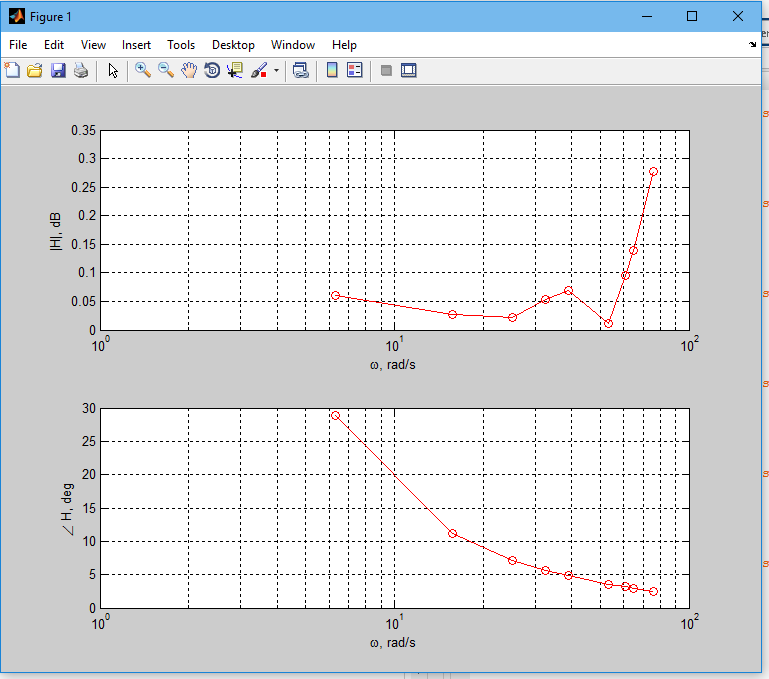
Plot bode from experimental data